What People Really Want in Hearing Aids: Insights From Over 4,000 Users
Prescription hearing aids and in-person care remain in high demand.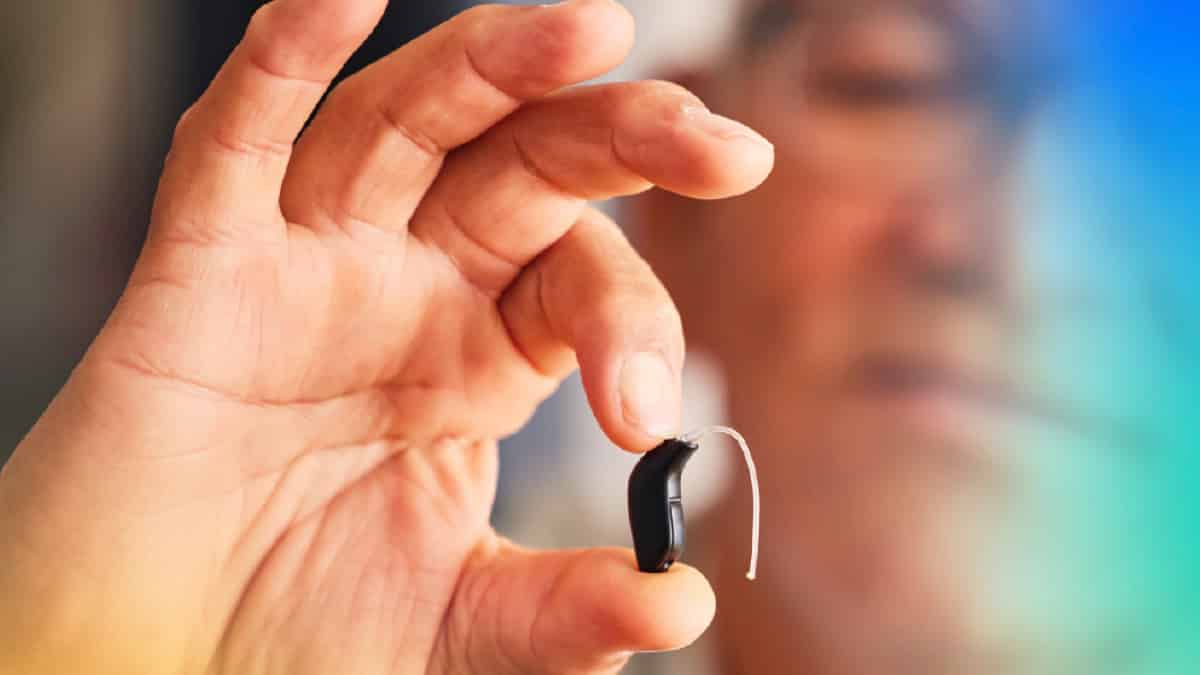
Hearing aid glossary
Looking that up…
Terms are matched automatically. A definition may not fit every context.
Over 4,000 people told us about their hearing loss, and what they're looking for in hearing aids. More than half (52.8%) had moderate hearing loss, about two-thirds (69%) preferred a behind-the-ear () or Receiver-in-Canal () hearing aid, and although over-the-counter () awareness appeared high, we observed a strong preference for prescription hearing aids with advanced features and professional care.
Learn how we collected the data before we dive into the results and our insights from them.
How We Gathered the Data
At the start of 2025, we created a tool to help people find the best hearing aids for their needs.


The tool quizzes people on what they're looking for and their preferences. We ask up to nine questions, addressing the level of hearing loss, the type of hearing aid and care the user prefers, specific features they need, and more. In addition to answering questions, users can move a slider to filter devices based on price. The top-3 matching hearing aid models are listed on the right-hand side, and users can compare them side-by-side by clicking the respective buttons.
We embedded the tool on our website and shared it in our consumer newsletter. At the time we evaluated the data, the quiz had been completed 4,877 times.
Caveat: We did not remove incomplete submissions or repeat submissions from the same address from the dataset. It's also important to remember that the following are self-reported consumer responses.
Question by Question Insights
In this section, we'll break down the results, one survey question at a time, and discuss what they tell us.
Hearing Loss Level
One of our first questions explored how users would rate their hearing problem: mild, moderate, severe, or profound. We didn't provide "none" as an option, but, as with all questions, it was possible to proceed without making a selection.
Level | Count | Percentage |
|---|---|---|
Moderate | 2,573 | 52.8% 🥇 |
Severe | 1,318 | 27.0% |
Mild | 685 | 14.0% |
Profound | 262 | 5.4% |

Insights:
- Over half of users (52.8%) have moderate hearing loss
- 8 out of 10 users have either moderate or severe hearing loss (79.8% of all users)
- Mild hearing loss is underrepresented (only 14%)
These results suggest users are seeking help at more advanced stages. This assumption is supported by observations that people often underestimate their level of hearing loss and live with symptoms for a decade or more before seeking or receiving appropriate care. The slow and almost unnoticeable progression of age-related hearing loss contributes to this significant delay in diagnosis and treatment.
Other studies and research say... Research has shown that people are poor judges of their own hearing status, and self-ratings rarely match audiometric thresholds. Some studies have found that 30-50% of adults estimate they have “normal” or “mild” hearing loss, when in fact they have “moderate” or worse hearing loss.1-3 This misidentification is likely due to the gradual onset of age-related hearing loss, adaptation to communication challenges (e.g., speech reading), and the fact that it's difficult to estimate your own hearing loss without using a good online hearing test or, better yet, visiting a hearing care provider.2-5 Ultimately, the research suggests that people tend to underestimate their hearing loss—until frequent and significant communication problems become obvious to them and their friends and family.
For reference, a large-scale study estimated that, for US residents aged 12 years or older, about 25.4 million, 10.7 million, 1.8 million, and 400,000 have mild, moderate, severe, and profound hearing loss.6
Hearing Aid Type
Here, we asked what type of hearing aid the user prefers: in-the-ear () or behind-the-ear ().
Type | Count | Percentage |
|---|---|---|
Behind-the-ear | 3,367 | 69.0% 🥇 |
In-the-ear | 1,390 | 28.5% |
Not specified | 120 | 2.5% |


Insights:
- dominates at 2.4x the rate of
- Only about 1 in 4 (28.5%) prefer ITE
Compared to BTE models, ITE devices are more discreet and won't interfere with glasses or masks. On the other hand, they may lack performance, battery life, and more advanced features like Bluetooth streaming and directional microphones found in BTE hearing aids.
Other studies and research say... By far, receiver-in-canal () models—a type of BTE with a wire connecting the hearing aid body to a speaker in the ear canal—are the most popular style. Hearing Industries Association (HIA) member statistics in 2020 showed RICs accounted for about 79% of all hearing aids sold in the United States, with traditional BTEs making up roughly 8% and the remaining ~13% split among custom in-the-ear (ITE), in-the-canal (), and completely-in-canal () styles (about 5% full/half-shell ITE, 5% ITC, 3% CIC).7
The MarkeTrak 2022 survey of hearing aid users and non-users conducted by HIA similarly show that BTE styles are the clear favorite (RICs 54% and traditional BTEs 10%), while custom ITE styles—full shell (12%), half shell (9%), invisible-in-canal (7%), and CIC (5%)—together comprised a much smaller share of the market.8
OTC vs. Prescription
When users self-identified as having mild or moderate hearing loss, we asked whether they were interested in over-the-counter (OTC) or prescription options. Users who responded that they have a severe or profound hearing problem didn't see this question because hearing aids aren't suitable for them.
Type | Count | Percentage |
|---|---|---|
Prescription | 2,098 | 66.1% 🥇 |
OTC | 1,074 | 33.9% |

Insights:
- Prescription still dominates at 2:1 ratio (66.1%)
- Only 1 in 3 eligible users (33.9%) prefers devices
Even though OTC awareness appears high, many who qualify for OTC devices still prefer prescription hearing aids. This suggests an overall preference for professional assistance and hearing aids with better performance and features, also reflected in the preference for over models.
Other studies and research say... The OTC hearing aid market remains opaque regarding its popularity and unit sales. Recent reviews that include the OTC market note that uptake remains low, users tend to be younger with milder losses, they tend to wear the devices for shorter periods, and many unknowns remain about long-term outcomes and professional intervention.9,10 Although some studies suggest that certain OTC hearing aids can produce benefits on par with prescription devices,11 it seems more likely that OTC and hybrid OTC systems (i.e., those that offer telecare assistance and/or remote programming) may help expand reach and affordability, but they do not fully replicate the benefits of professionally administered care.12
Power Source
We asked users which power option they prefer: rechargeable or replaceable/disposable batteries.
Type | Count | Percentage |
|---|---|---|
Rechargeable | 4,101 | 88.5% 🥇 |
Disposable | 531 | 11.5% |
Not specified | 245 | 5.0% |


Insights:
- Rechargeable is overwhelmingly preferred (8:1 ratio or 88.5%)
- Just over 1 in 10 users (11.5%) still prefers disposable batteries
This signals a clear market shift, with rechargeable batteries now expected by some consumers as standard. Disposable batteries do present some advantages over rechargeables, but they can be more expensive in the long run, are more difficult to handle, and contribute to waste. At the same time, the battery life of rechargeable hearing aids has increased significantly over the past decade, with some devices, like the Starkey Edge AI, offering as much as 51 hours per charge.
Other studies and research say... Hearing Industries Association (HIA) statistics in 2021 indicated that 4 out of 5 (79.4%) receiver-in-canal and behind-the-ear hearing aids were rechargeable.
Phone Preference
We asked respondents for their smartphone preference: Android, iPhone, or no preference.
Type | Count | Percentage |
|---|---|---|
iPhone | 2,833 | 63.8% 🥇 |
Android | 1,604 | 36.2% |
No preference | 281 | 5.8% |

Insights:
- iPhone users dominate at nearly 2:1 ratio (63.8%)
- 94.2% specify a phone preference (very high)
A large majority of respondents identified with a specific mobile operating system, indicating that Bluetooth phone connectivity is a critical feature for most users. And with almost two in three potential hearing aid users owning an iPhone, the Made for iPhone () certification carries high value. However, with the rollout of Auracast technology, it might lose importance over the next decade if Apple continues not to implement it.
Except for the smallest in-ear devices, most prescription hearing aids from major global hearing aid companies (except the smallest in-ear devices) are now compatible with both Android and Apple (iOS)—although hands-free phone calling is more limited. By comparison, far fewer hearing aids have wireless capabilities, and those that do often offer only iOS or Android.
Other studies and research say... The dominance of iPhone users is no surprise, but in our quiz they may be slightly overrepresented. In the U.S., iPhone users account for about 58% of smartphone users, while Android users make up about 42%.13
MarkeTrak 20228 found that iPhone owners were more likely to use hearing aid wireless streaming features than Android users. This could be due to Apple’s Made-for-iPhone (MFi) ecosystem, more widespread implementation in hearing aids, more consistent Bluetooth behavior across devices, and a simpler user experience for pairing.
Purchase Channel
The 3,516 users who preferred a prescription hearing aid were asked how they would prefer to be fitted with their hearing aid: with an expert at a local clinic, with an expert coming to their home, or on a video call with an expert.
Channel | Count | % of Rx Users |
|---|---|---|
Clinic | 3,223 | 91.7% 🥇 |
Telehealth | 257 | 7.3% |
Home | 36 | 1.0% |


Insights:
- In-clinic purchases dominate at 92% (13:1 ratio vs. telehealth)
- Telehealth is emerging but still only 7.3%
- Home purchase option barely registers (1%)
Users who want a prescription hearing aid clearly prefer in-person care at a clinic. However, telehealth has significant room for growth, and HearingTracker is generally excited about how it might expand access and affordability to consumers.
Other studies and research say... As noted in the “ vs. Prescription” section above, there are OTC and OTC hybrid (OTC + telecare and teleprogramming) products that can help those with mild-to-moderate hearing loss; however, studies also indicate that individualized in-person care makes a difference in outcomes.12 MarkeTrak 2025 indicates 60% of OTC owners who did not receive professional assistance felt that it would have been helpful to them, and over half indicated they will buy their next hearing aid in-person from a professional.10 Tellingly, the number of important items (e.g., real-ear measurements, subjective/objective benefit measures, etc.) included during an in-person prescriptive fitting has been correlated with a greater likelihood for success and satisfaction with hearing aids.14
Connectivity Features
In our last set of questions, we explored must-have features. Our first set looked into connectivity features: wireless streaming, hands-free-calling, and onboard . Users could select all that apply.
Feature | Count | Percentage |
|---|---|---|
Wireless streaming | 3,157 | 64.7% 🥇 |
Hands-free calling | 2,141 | 43.9% |
Onboard telecoil | 726 | 14.9% |

Insights:
- Wireless streaming is essential for 2 out of 3 users (64.7%)
- Hands-free calling important for less than half (44%)
- (for ) is niche at 14.9%
Modern hearing aids increasingly pull double duty. Not only do they amplify speech and ambient sounds, they also serve as earbuds or headphones replacements for streaming phone calls and other audio. , a new Bluetooth technology, will likely make audio streams in public places more common than existing hearing loop systems, something technophile users are certainly aware of.
Other studies and research say... MarkeTrak 2025 suggested that about 70% of hearing aid owners have hearing aids with some type of wireless capability—and increase from 42% in 2015.10
Sound Features
For our second set of must-have features, we looked at which sound features users need: noise removal, , and extended bandwidth. Again, respondents could select all that apply.
Feature | Count | Percentage |
|---|---|---|
AI Noise Removal | 3,000 | 61.5% 🥇 |
Frequency Lowering | 1,305 | 26.8% |
Extended Bandwidth | 810 | 16.6% |


Insights:
- noise removal is the #1 sound feature (3 in 5 users or 61.5%)
- for severe loss users is important to just over 1 in 4 users (27%)
- Extended bandwidth is less desired (16.6%)
Even though AI in hearing aids may seem like a recent phenomenon, machine learning for signal processing, a subset of artificial intelligence, has been around for decades. The first hearing aid to pair AI with integrated sensors was the Starkey Livio AI.
Advanced Features
Finally, we grouped a set of advanced features and asked which ones users considered must-haves: water- or dust-resistance, tap controls, and fall detection. As with the other sets of features, users could select all that apply.
Feature | Count | Percentage |
|---|---|---|
Water- and dust-resistance | 2,601 | 53.3% 🥇 |
Tap Controls | 1,342 | 27.5% |
Fall Detection | 525 | 10.8% |
Insights:
- Water/dust resistance is critical for over half of users (53.3%)
- Tap controls desired by over 1 in 4 (27.5%)
- Fall detection still niche (10.8%)
Considering how expensive hearing aids can be, it seems surprising not more users would want them to be water- and dust-resistant to withstand sweat, rain, or accidental submersion. While there is no such thing as a waterproof hearing aid, an IP68 rating is the gold standard for users with an active lifestyle.
5 Unique Survey Insights
Here, we look at the more subtle insights that emerge when analyzing how different user groups answered the quiz.
iPhone Users Are More Feature-Hungry
- iPhone users want wireless: 71.1% vs. Android: 61.8% (15% more likely)
- iPhone users want noise: 64.6% vs. Android: 60.9%
- iPhone users want rechargeable: 87.2% vs. Android: 82.7%
iPhone users have higher expectations across all premium features. They're not just brand-conscious about phones—they expect premium experiences everywhere.
OTC Users Prefer ITE; Rx Users Prefer BTE
- users: 52.1% vs. 45.0%
- Prescription users: 76.2% BTE vs. 22.4% ITE

While dominates overall (69%), buyers actually prefer by a slight margin.
Why?
- OTC buyers want discretion (less stigma)
- They're likely younger/more appearance-conscious and in the workforce
- ITE looks and feels more like "normal" earbuds/AirPods
OTC Users Have Much Lower Feature Expectations
- OTC user preference for wireless streaming: 55.2% vs. Rx: 69.7% (14.5% gap)
- OTC user preference for noise: 47.1% vs. Rx: 68.4% (21.3% gap!)
OTC users are willing to sacrifice advanced features. They prioritize price, discretion (ITE), and possibly ease-of-use (i.e., basic functionality). Although we did not measure this, many OTC wearers are situational users rather than seeking an all-day solution.
OTC Market Is Mostly Moderate
- 73.6% moderate hearing loss
- 26.4% mild hearing loss
While OTC is capturing the "early intervention" market—people with less severe hearing loss who want to try hearing aids without a clinic commitment—most survey respondents who chose OTC over prescription self-identified as having moderate hearing loss. Ideally, we'd see more responses from people with mild hearing loss, and thus a higher share among survey respondents, and a higher number of people with moderate losses progressing to prescription hearing aids with professional care sooner. However, as noted above (see "Hearing Loss Level”), it's likely that many survey respondents were underestimating the severity of their hearing loss.
Severe Loss = Major Shift in Preferences
As hearing loss worsens, dramatic changes occur:
Loss Level | BTE Preference | Rechargeable | Disposable |
|---|---|---|---|
Mild | 58.1% | 90.2% | 5.7% |
Moderate | 67.2% | 88.1% | 8.0% |
Severe | 76.9% | 78.5% | 16.2% |
Profound | 79.0% | 61.8% | 27.5% |
Key Pattern: Profound users DROP to only 61.8% rechargeable (vs. 90% for mild)! In line with this, the preference for disposable batteries increases to 27.5% (vs. 5.7% for mild).
Why?
- Profound loss needs POWER—rechargeable may not provide enough
- Disposable batteries = more reliable/longer life for high-drain users
- They need hearing aids to WORK in ALL situations (e.g., during travel, power outages, etc.), not just be convenient
- Rechargeable batteries—which use lithium-ion chemistry just like your cell phone—gradually degrade in power efficiency over time, so disposable batteries may be a better option for users who want to keep their power hearing aids for 5+ years
Also: preference increases linearly with severity (58% → 79%). Higher levels of hearing loss mean more processing and power drain for the hearing aids. Generally speaking, and traditional BTEs have larger battery capacity and more features (sophisticated processing, tinnitus programs, directional microphones, wireless accessories, etc.) that can be especially useful for people with more severe hearing losses.
What Else?
The survey has given us a lot of insights, but also leaves many questions open. It's unclear whether or not respondents already use a hearing aid, how they were diagnosed with hearing loss, and whether they have a specific form of hearing loss or related conditions (e.g., issues with dexterity or balance) that would impact their choice. We also didn't query for personal information like age, gender, income level, or location, which could add further depth to our analysis and verify assumptions. Finally, we didn't analyze how people interacted with the price filter.
References
- Wallhagen M, Strawbridge W, Cohen R. Self-assessment of hearing ability in older adults. J Am Acad Audiol. 1997.
- Sindhusake D, Mitchell P, Smith W, et al. Validity of self-reported hearing loss in older adults. Ear Hear. 2001;22(4):297-302.
- Davis A. The prevalence of hearing impairment and reported hearing disability among adults in Great Britain. Int J Epidemiol. 1989.
- Gates GA, Mills JH. Presbycusis. Lancet. 2005.
- Sygrove C. What’s a hearing number and why you should know yours. Feb 15, 2025.
- Goman AM, Lin FR. Prevalence of hearing loss by severity in the United States. Am J Public Health. 2016 Oct;106(10):1820-1822.
- Strom KE. Trends in hearing aid styles. Hearing Review. 2021;28(7):6,31.
- Picou EM. Hearing aid benefit and satisfaction results from the MarkeTrak 2022 survey: Importance of features and hearing care professionals. Semin Hear. 2022; 43(04): 301-316.
- Chung K, Zeng FG. Over-the-counter hearing aids: Implementations and opportunities. Front Audiol Otol. 2024; 2.
- Dobyan B. 20Q: Interpreting the hearing health landscape through MarkeTrak— From insight to impact. AudiologyOnline; Aug 11, 2025.
- De Sousa KC, Manchaiah V, Moore DR, Graham MA, Swanepoel DW. Long-term outcomes of self-fit vs audiologist-fit hearing aids. JAMA Otolaryngol Head Neck Surg. 2024;150(9):765–771.
- Wu YH, Stangl E, Branscome K, Oleson J, Ricketts T. Hearing aid service models, technology, and patient outcomes: A randomized clinical trial. JAMA Otolaryng-Head Neck Surg. 2025; doi:10.1001/jamaoto.2025.1008
- Statcounter. Mobile operating system market share. USA (Oct 2024-Oct 2025).
- Kochkin S, Beck DL, Christensen LA, Compton-Conley C, et al. MarkeTrak VIII: The impact of the hearing healthcare professional on hearing aid user success. Hearing Review. 2010;17(4):12-34.
)
Tina Sieber, PhD
Health WriterTina Sieber is a technology journalist with over 10 years of experience and a PhD in Biochemistry. Following an episode of sudden one-sided hearing loss, she was diagnosed with a benign brain tumor in 2018. She has since started writing about hearing loss and reviewing hearing aids for major tech publications.
)
Karl Strom
Editor in ChiefKarl Strom is the editor-in-chief of HearingTracker. He was a founding editor of The Hearing Review and has covered the hearing aid industry for over 30 years.
)
Abram Bailey, AuD
Founder and PresidentDr. Bailey is a leading expert on consumer technology in the audiology industry. He is a staunch advocate for patient-centered hearing care and audiological best practices, and welcomes any technological innovation that improves access to quality hearing outcomes. Dr. Bailey holds an Au.D. from Vanderbilt University Medical Center.